
From bulk tissue to single-cell resolution — rigorous, publication-ready transcriptomic workflows. We focus on solving your biological question, providing expert guidance rather than just running automated pipelines.
Transcriptomics powers discovery across the full spectrum of life science research.
Uncover gene expression dysregulation in cancer, neurodegeneration, autoimmune and rare diseases.
Identify novel therapeutic targets and characterize drug mechanisms of action at transcriptomic level.
Discover and validate expression-based biomarkers for diagnosis, prognosis or treatment stratification.
Define and annotate cell populations with single-cell resolution in complex tissues and organoids.
Map regulatory networks and signaling cascades altered under your experimental condition.
Publication-ready figures, methods sections and supplementary data for high-impact journals.
Whole-transcriptome profiling from bulk tissue or cell populations. We go beyond standard pipelines with custom statistical modeling, ensuring your differential expression results are biologically meaningful, not pipeline artifacts.
The industry standard for expression profiling in eukaryotes. Robust and precise quantification of protein-coding genes for comparative studies.
Captures the entire spectrum: coding RNAs and long non-coding transcripts (lncRNAs). Ideal for deep regulatory studies and degraded tissue (FFPE).
Specialized pipelines for identifying known and novel microRNAs, isomiR profiling, and integrative target prediction (TargetScan, miRanda).
Simultaneous analysis of eukaryotic host and pathogen transcriptomes. Essential for characterizing infection mechanisms and interactions in vivo/in vitro.
Gene expression mapping preserving tissue architecture (Visium, Xenium). Frequently integrated with scRNA-seq data to deconstruct the biological niche.
Evaluating active gene expression in microbiomes and complex microbial communities to understand ecosystem pathways and functions.
Robust DEG identification with DESeq2, edgeR and custom statistical models. We rigorously account for confounders, batch effects and complex experimental designs.
Systems-level functional annotation (GO, KEGG, Reactome). GSEA analysis to discover global behavior of metabolic pathways and cell signaling, using pre-ranked lists and custom gene sets.
WGCNA-based module detection to identify clusters of genes that act in a coordinated manner. We statistically correlate these modules with your key clinical or phenotypic traits.
We deploy Machine Learning techniques for feature selection, isolating the expression signatures with the highest discriminative and predictive power to create diagnostic or prognostic panels.
Rigorous quality control at every step. We identify and correct batch effects while carefully preserving true biological variance, using gold standard methods like ComBat and limma.
The pipeline is just the means. We provide an exhaustive discussion of what the results mean biologically in the context of your question, backed by direct 1-to-1 contact.
Reference parameters for standard Bulk RNA-Seq projects. Custom designs available on request.
| Parameter | Specification |
|---|---|
| Input material | Total RNA · Poly-A enrichment or rRNA depletion |
| Minimum RNA input | 500 ng (optimal) · 100 ng (low-input protocol available) |
| RNA integrity (RIN) | ≥ 7.0 recommended · FFPE-compatible protocol available |
| Sequencing depth | 20–50 M reads per sample (standard) · up to 100 M for low-expression targets |
| Read length | Paired-end 150 bp (PE150) |
| Accepted organisms | Human · Mouse · Rat · Any organism with reference genome |
| Minimum samples | 3 biological replicates per condition (recommended) |
| Data quality | Q30 ≥ 85% · Raw + processed data delivered |
| Deliverables | Interactive HTML report · Count matrices · DEG tables · Pathway results · Methods text |
Going beyond standard pipelines with advanced Machine Learning, resolving cellular heterogeneity at unprecedented resolution.
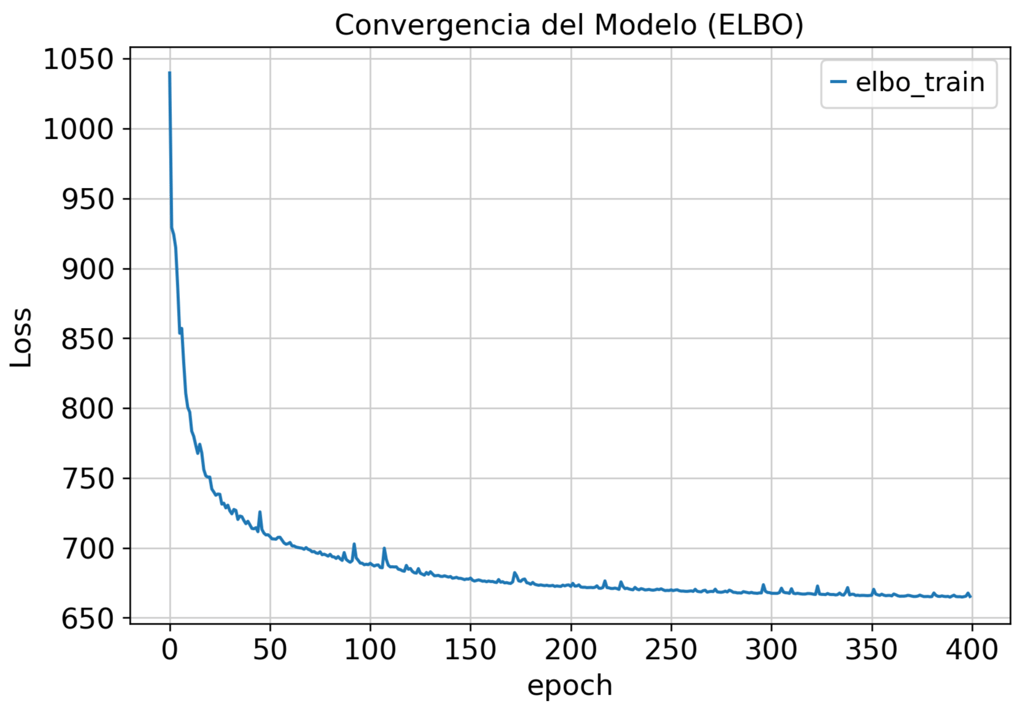
By leveraging this advanced statistical modeling, we achieve:
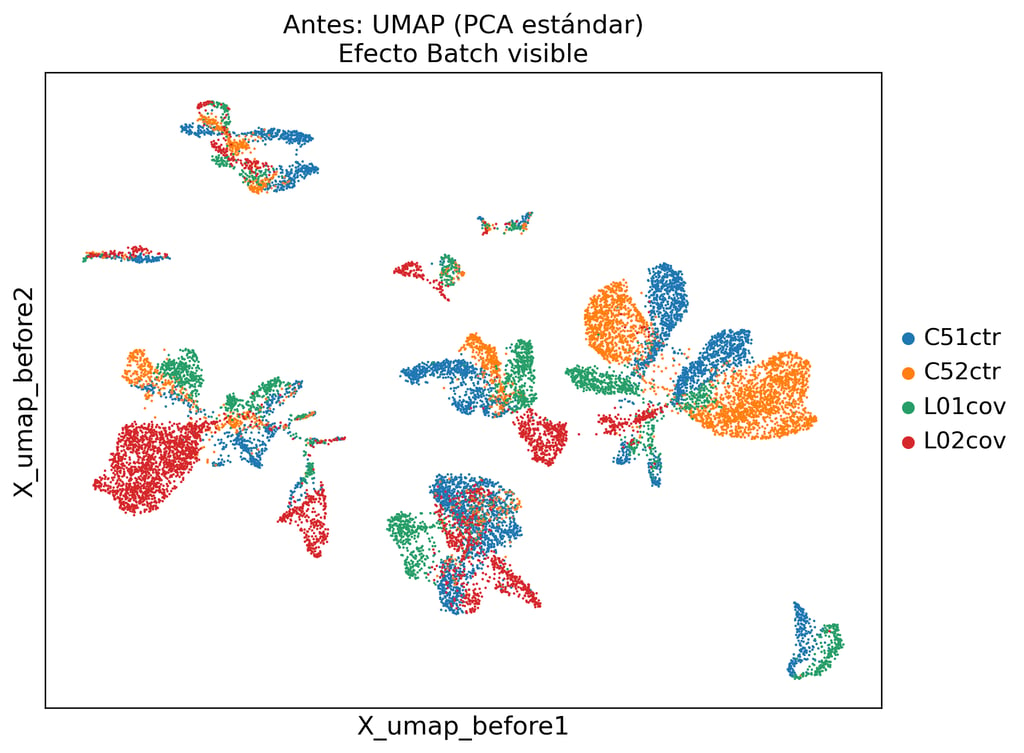
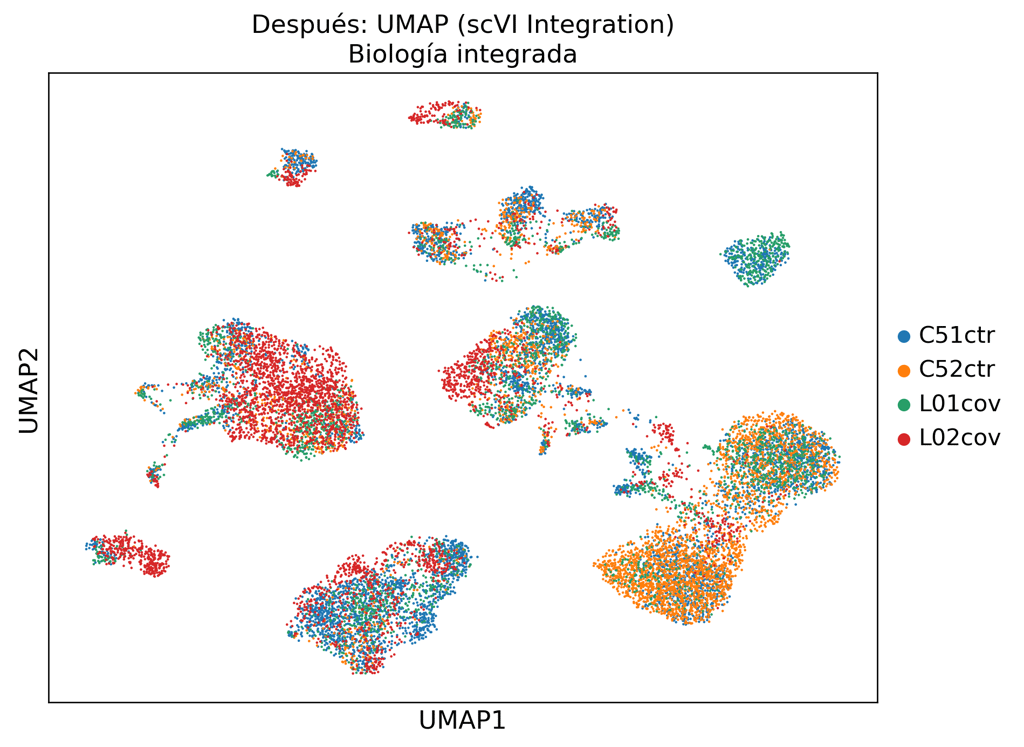
Standard PCA-based integration fails to remove technical variation. Our scVI pipeline separates biological signal from batch noise.
Doublet removal, low-quality cell exclusion, ambient RNA correction
Scran pooling or scVI probabilistic normalization
Deep generative model learns latent biological representation
Leiden clustering + marker-based cell type annotation
Pseudo-bulk DE, trajectory inference, cell-cell communication
Most providers run your data through a generic automated pipeline. We do the opposite: every dataset is analyzed with a workflow built specifically for your experimental design, biology, and research question.
Every Intusomics project is delivered with dynamic, fully interactive visualizations, from high-resolution volcano plots to complex single-cell clustering models. We provide an intuitive environment where you can drill down into individual data points, query exact p-values, isolate specific cell populations, and trace biomarker signatures in real-time. Experience complete transparency and full autonomy over your research findings.